Benefits
Simple by design. Stays in your Fabric.
You do not learn a new observability product UI. You grant workspace access — results appear in your Lakehouse and the deployed Power BI report.
-
Radically simple to operate Two setup steps, then scheduled scans. No YAML rule catalogs, no PK/FK definitions, no Spark notebooks for analysis.
-
Nothing leaves customer Azure / Fabric Results write back to the Lakehouse you choose. The report runs Direct Lake in your tenant — no external data plane.
-
No new tool to learn Analysts stay in Fabric + Power BI. You only add service principal access to monitored workspaces and the output Lakehouse.
-
Marketplace-priced $49 / container / month for the software offer — without an enterprise observability contract. Billed through your existing Azure subscription, so you do not need to onboard a new vendor. Get it on Marketplace.
Detectors
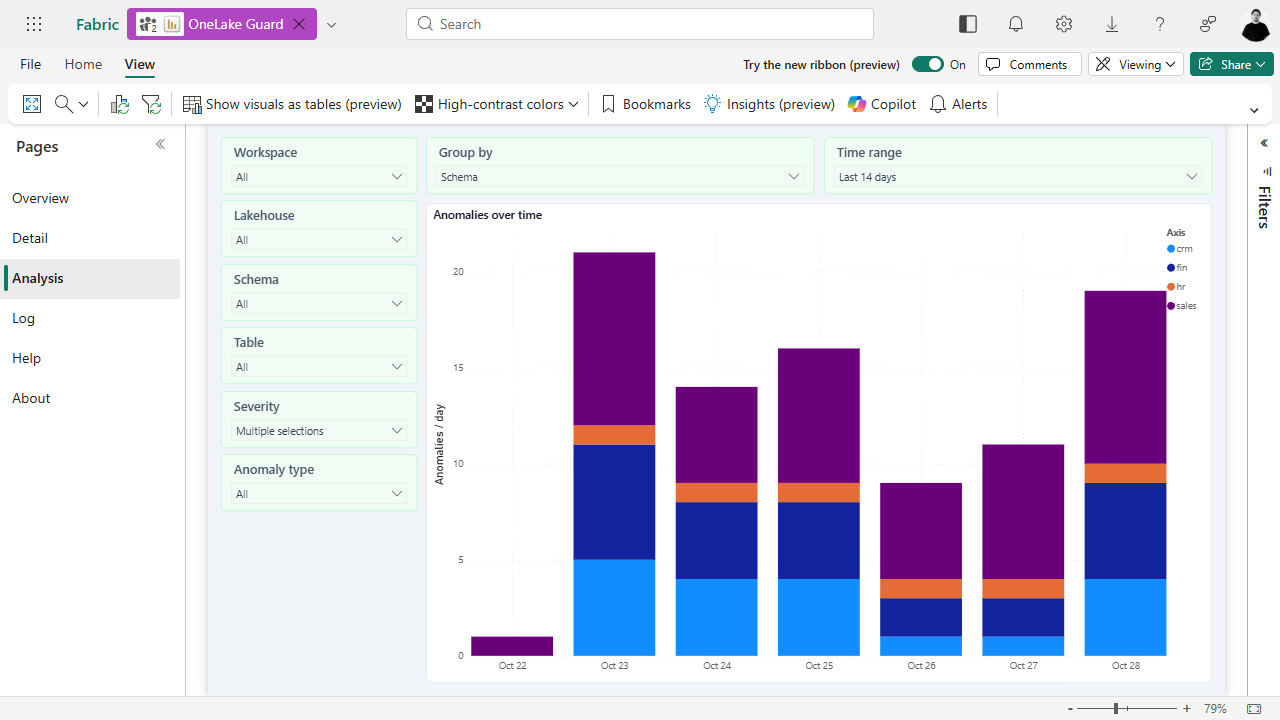
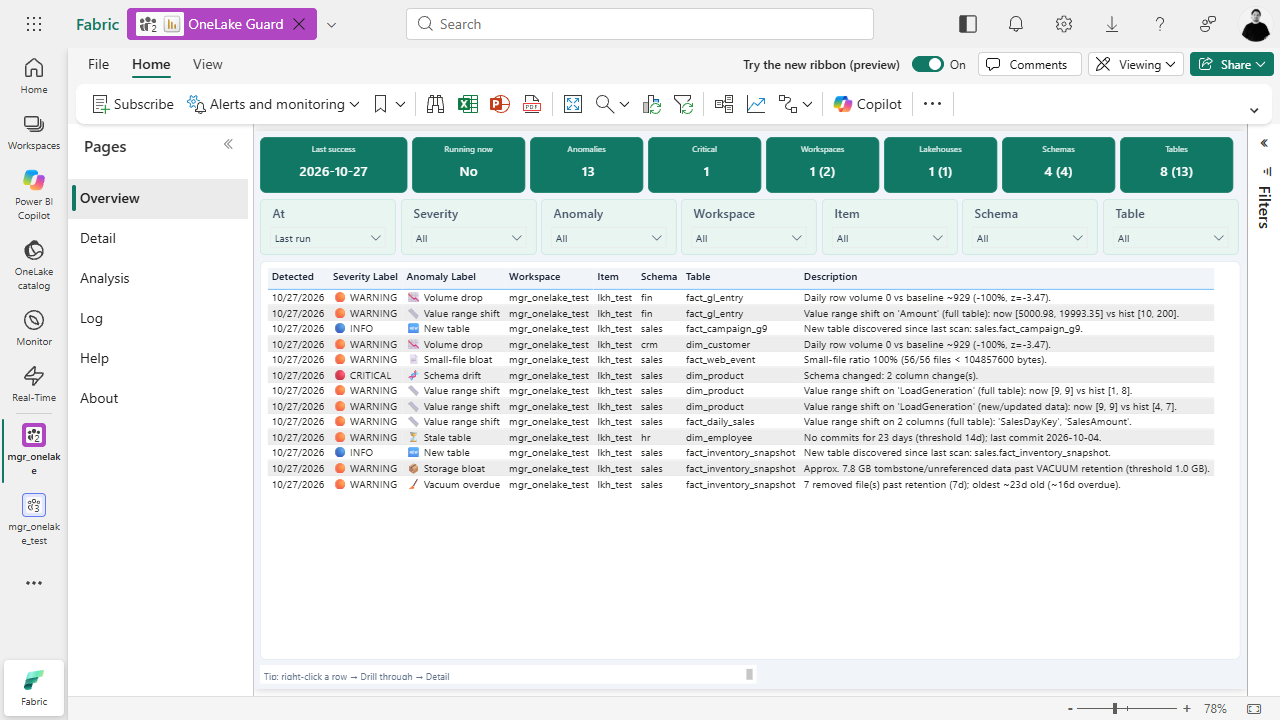
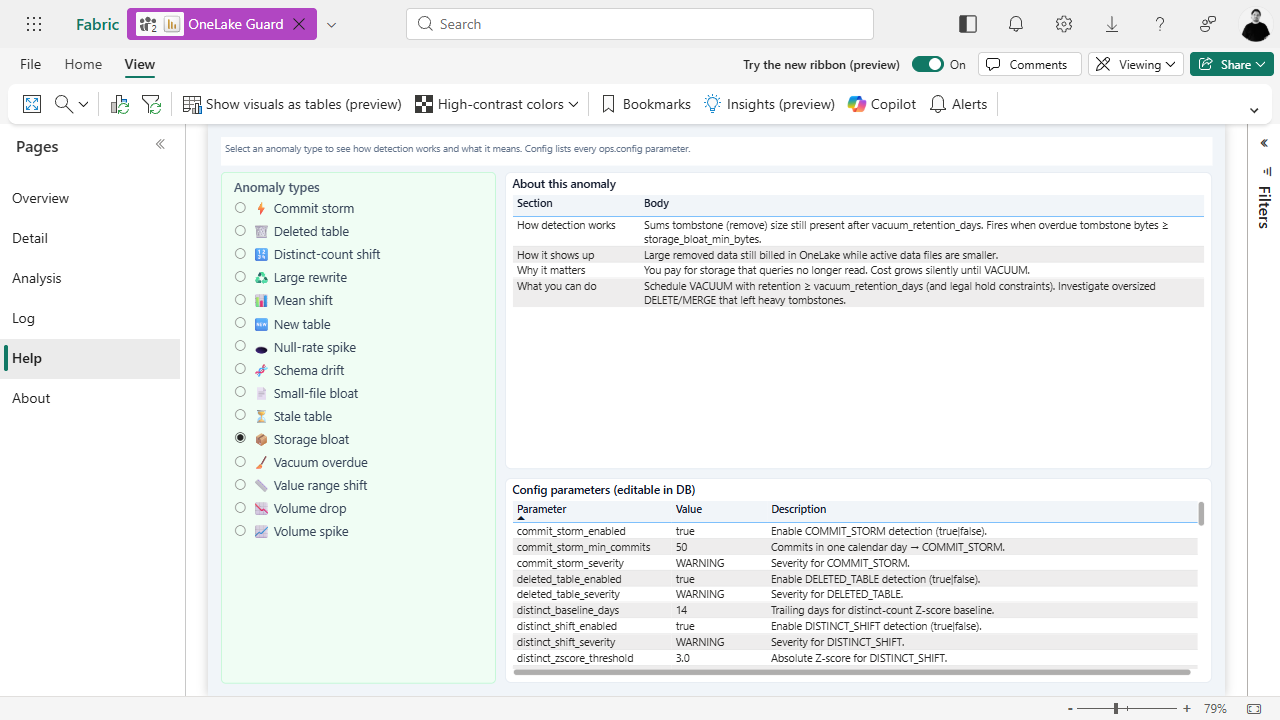
What we detect — and why it matters
Zero-config detectors over OneLake Delta tables. Built for trust signals and Direct Lake health.
| Detector | What it catches | Why detect it |
|---|---|---|
NEW_TABLE |
Table appeared that was not in the previous completed scan | Spot unexpected creates or new landing zones early |
DELETED_TABLE |
Previously monitored table is no longer discoverable | Catch drops, renames, moved paths, or lost Viewer access |
SCHEMA_DRIFT |
Column add/remove/type changes between Delta versions | Stops silent breaks in reports, Direct Lake models, and jobs |
VOLUME_SPIKE |
Daily row volume unusually high vs baseline (Z-score) | Flags backfills, duplicate loads, or upstream surges |
VOLUME_DROP |
Daily row volume unusually low vs baseline (Z-score) | Often failed/partial ETL or a silent pipeline stop |
NULL_RATE_SPIKE |
Share of nulls in a column jumped vs recent history | Missing joins, broken mappings, source quality regression |
VALUE_RANGE_SHIFT |
Column min/max moved outside the seen envelope | Unit/currency changes, bad casts, new outlier populations |
MEAN_SHIFT |
Column mean shifted vs baseline (light-scan) | Business metric drift or ETL scaling/unit issues |
DISTINCT_SHIFT |
Approximate distinct count shifted vs baseline | Cardinality explosion or collapse (broken keys / duplicates) |
STALE_TABLE |
No commits longer than the stale threshold | Abandoned table, stopped pipeline, or delayed landing |
COMMIT_STORM |
Unusually many Delta commits in one day | Micro-batching / row-by-row writes → latency & small files |
LARGE_REWRITE |
Single commit rewrote/deleted a large number of rows | Expensive overwrite/MERGE patterns; storage & compute cost |
SMALL_FILE_BLOAT |
Too many tiny Parquet files relative to total files | Protects Direct Lake latency and OneLake list/read cost |
STORAGE_BLOAT |
Large tombstone / unreferenced data past VACUUM retention | You pay for GB queries no longer use until VACUUM |
VACUUM_OVERDUE |
Removed files older than retention still present | Maintenance debt — schedule VACUUM to reclaim space |
Two steps to turn it on
Service principal + workspace access — then automatic scans in Fabric.